Tables
Organize data clearly and describe what it means.
Impact
Tables are great for organizing information, like schedules, prices, or data comparisons. But when they are not built with accessibility in mind, they can be a real barrier for people with disabilities, especially those who use screen readers or keyboard navigation:
| Access Barrier | Impact |
|---|---|
| Screen reader confusion | If a table does not have proper table headers, a screen reader cannot tell what each cell means. Imagine hearing a list of numbers with no context. |
| Keyboard traps | Some tables cannot be navigated easily with a keyboard, which is essential for people who cannot use a mouse. |
| Visual overload | Tables with too many rows, columns, or no clear structure can be overwhelming for people with cognitive disabilities. |
| Going off the screen | Some tables have so many columns or columns are so wide that they go off the screen. You must scroll vertically and horizontally across the screen to view the content. But if the table headers disappear as you scroll, you can lose context fast. |
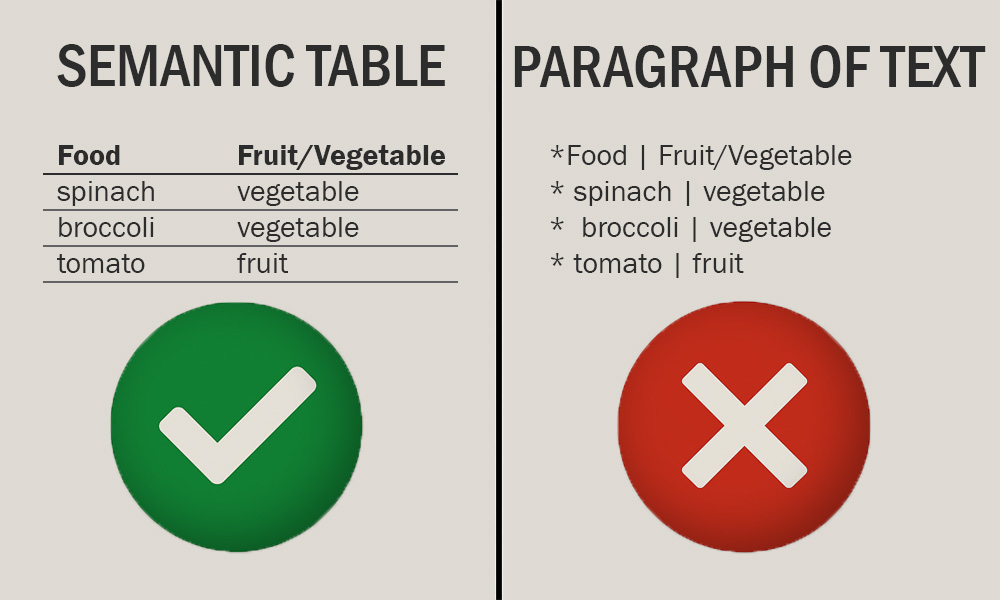
Did you know? Screen reader users can hear a semantically defined table in a special way. In this example, the screen reader may announce this section as, "Table with 2 columns and 3 rows." The user can then navigate around the table. For example, it might say, "Food: spinach. Fruit or Vegetable: vegetable" when the user jumps to the second row of the tabular data. If the table headers are defined properly, the user will never get lost moving around in the table.
If the table is not defined as a table, because it uses symbols and spacing to appear like a table, the screen reader might say something like, "Food vertical bar Fruit slash Vegetable. spinach vertical bar vegetable. broccoli vertical bar vegetable. tomato vertical bar fruit." The user cannot navigate around the table.
A paragraph of text and symbols is confusing and causes a common access barrier.
How to
Semantic tables are tables that are created using the built-in list tools in word processors, email editors, or web content editors. Most modern tools (like Canvas, Microsoft Word, Excel, PowerPoint, or Outlook) have built-in buttons for tables.
These tools add structure behind the scenes that helps both people and technology understand the content better. Use them instead of typing symbols or adding spaces manually.
Tables can be very tricky in PDFs. If you create your content in Word, use proper table formatting, and export it to PDF, the table structure should carry over. This saves time and ensures accessibility.
Step 1: Insert a table
In Canvas’ Rich Content Editor, select the Table button, then choose the number of rows and columns you need.
Step 2. Add a Caption
- Select any cell inside your table.
- Select the Table button, and then Table properties.
- Check the box for Show caption, then select Save.
- A caption field will appear above the table—type a short description of what the table is about.
3. Identify table header cells
- Select the top row (or first column) that contains your headers.
- Select the Table button, Cell, and then Cell properties.
- In the Cell Type dropdown, choose Header cell.
- In the Scope dropdown:
- Choose Column for top-row headers.
- Choose Row for first-column headers.
- Select Save.
Use the built-in accessibility checker to see if any of your tables are missing proper table header structure.
Best practices
Frequently asked questions
Additional guidance
You can learn more about providing semantic tables and other text with the following accessibility guides: